
Problem
Space for development in cities like London is limited and there is increasing pressure to build upwards and exploit underutilized spaces on the top of existing buildings. Set against this is a desire to minimise the visual impact of new buildings on the streetscape, particularly in historic areas. The less you can see a new addition from the street, the more likely it is to gain planning permission.
Proposal
Our idea was to develop a tool for generating and assessing the visual impact of potential rooftop additions in a three-dimensional environment whereas so many studies are currently conducted in two dimensions only. We aimed to give a designer an initial set of massing options and their relative visual impact scores in order to inform further design development.
Create Context

The first Dynamo graph is to bring in the context around the chosen building. We downloaded data for a chosen area of London’s West End from OpenStreetMap and used the Elk package to create the building footprints. This part of London has very limited building height data so we randomised building heights for the Hackathon but this data could be replaced with accurate survey data. A regular grid of points is placed over the surrounding context to provide the viewpoints for assessing the visual impact. We kept the number of viewpoints to a minimum for testing but more work would be needed to work out the optimum balance between accuracy and computation time. Points that fall outside of a chosen radius, or are under nearby building, are filtered out. The graph finishes by exporting the geometry (buildings, viewpoints, chosen building roof surface) to SAT files for onward use in the next stage.

Generate Rooftop Form

The second Dynamo graph creates and assesses potential rooftop additions. We wanted the tool to generate potential forms rather than just be a tool for assessing proposals. To keep it simple for the time constraints of a hackathon we chose to use a basic cuboid that could be controlled with a minimal number of parameters. At this stage, we also decided to use volume as the measurement that we would assess the viability of the scheme in financial terms. The useable areas within the addition would be a more accurate measure but would have required more work. The cuboid is defined by a length, width and height around an origin that can be offset in X and Y from the centroid of the roof surface. The cuboid can be rotated to give a wide variety of possible configurations from just six parameters. If the cuboid overhangs the roof polygon, it is trimmed so that it is entirely within the boundary of the existing building.

Assess Visual Impact
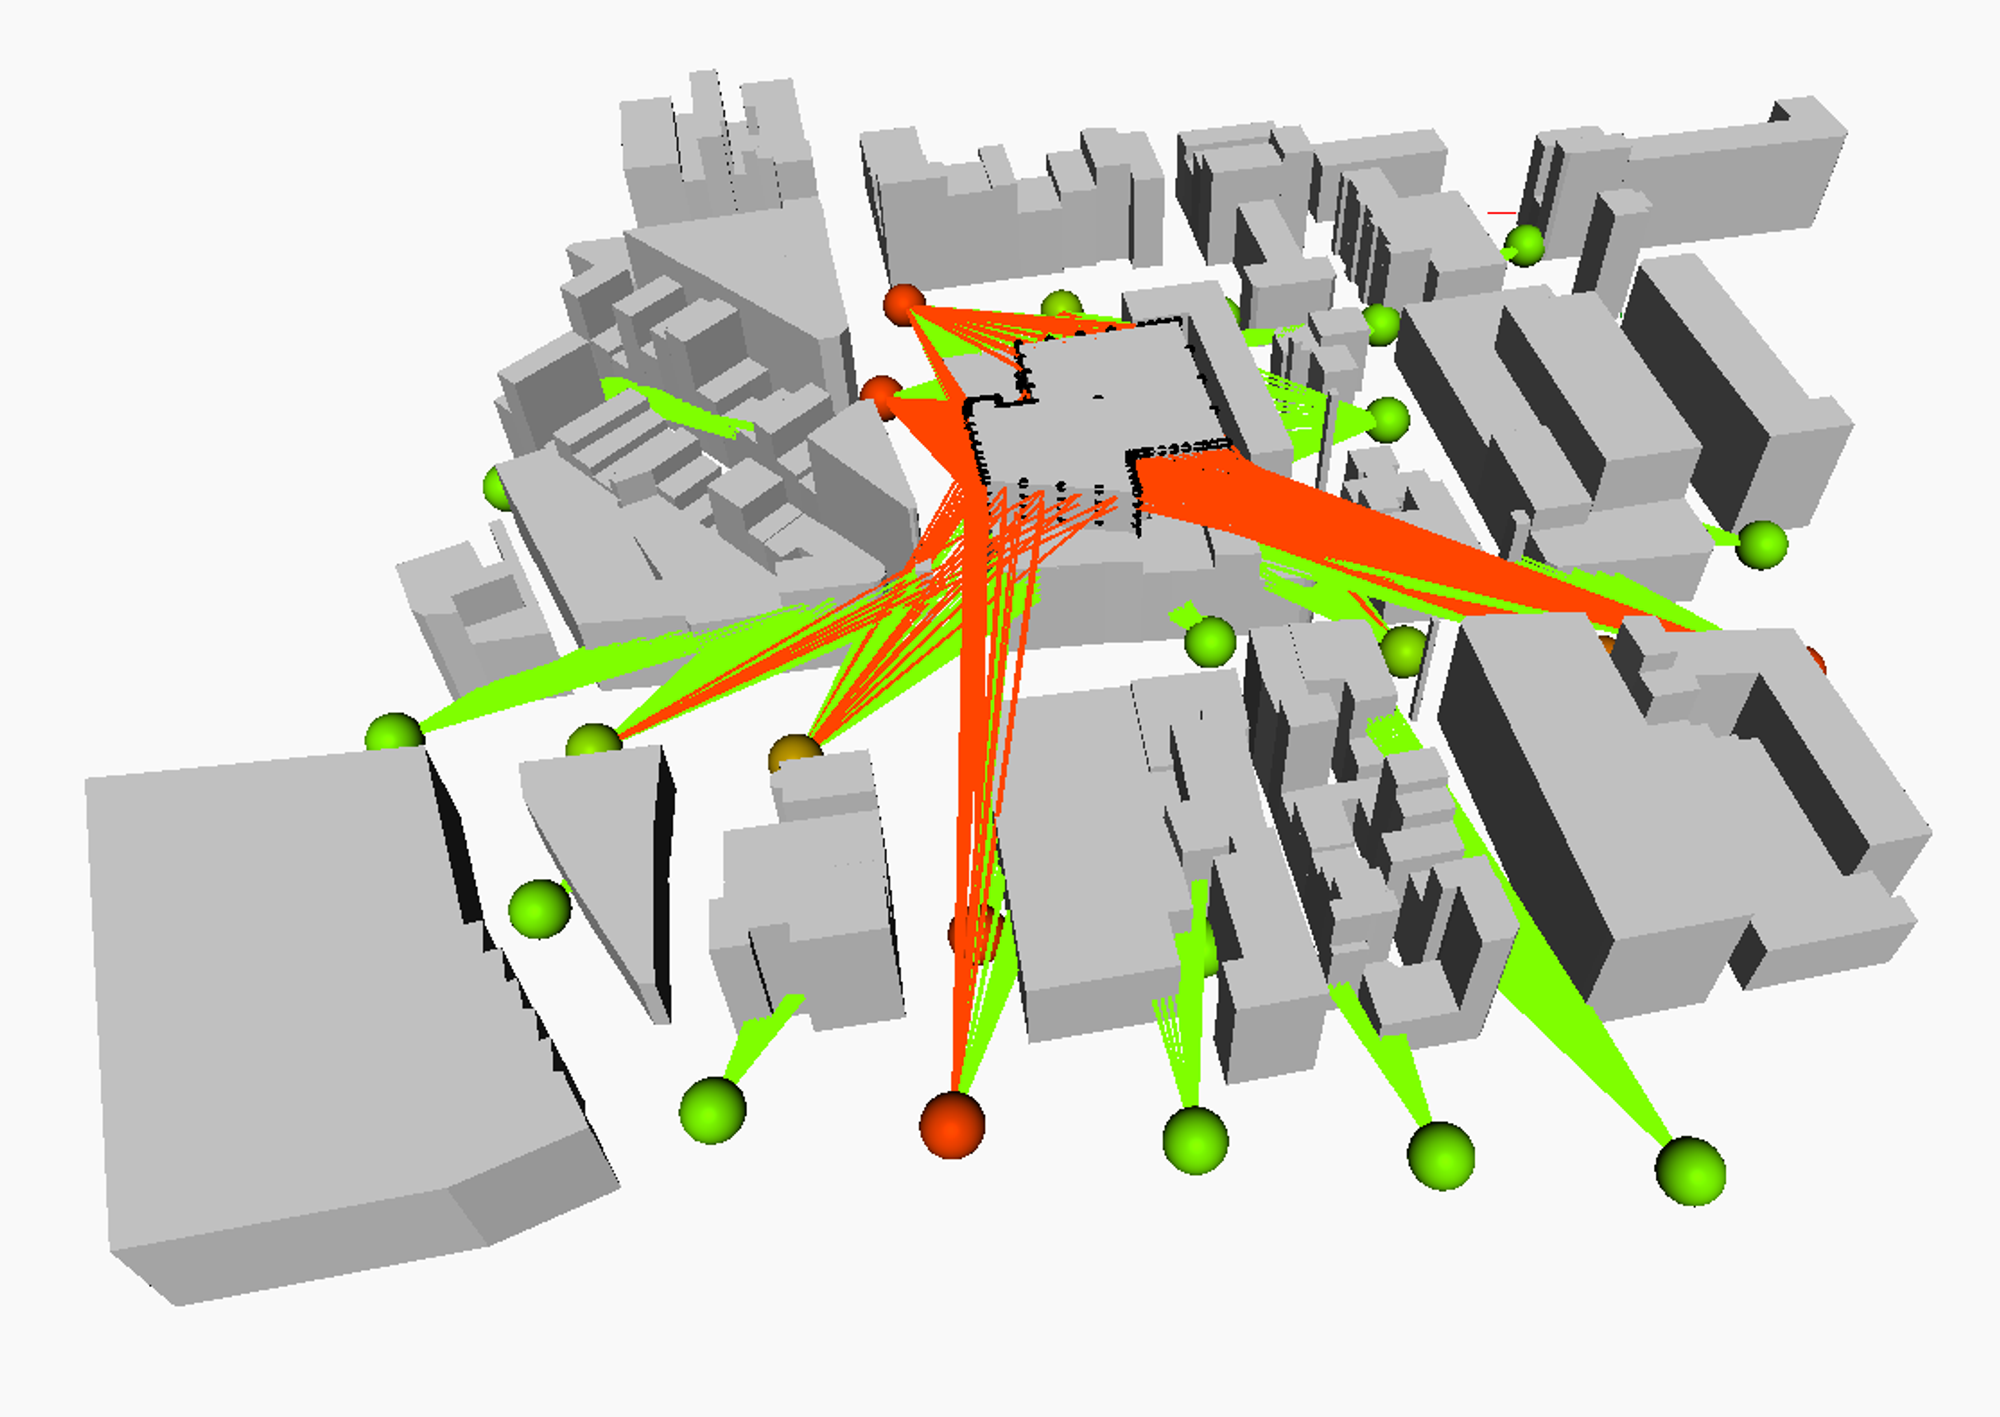
We spent a large part of the first day trying to work out a suitable method for assessing the visual impact from a particular viewpoint. After experimenting with several different methods, including isovists and projecting geometry onto a plane to measure areas, we settled on the relatively simple method of dividing the visible surfaces of the rooftop addition into panels using the Lunchbox package and then testing whether each panel could be seen from each viewpoint or was blocked by surrounding buildings. The score for each viewpoint is the percentage of panels that cannot be seen from the viewpoint. The higher the percentage, the less of the addition can be seen from the viewpoint. The total score is the average of all of the viewpoints and which we referred to as the Mean Score. Currently, the viewpoints are all treated equally but a future enhancement would be to weight their scores depending on the sensitivity of the street. For example, viewpoints that look towards buildings of historic significance would count more to the scoring than viewpoints from a back street. The designer would then be able to take into account these restrictions when developing the design.


For expediency, we used the same panel division for all faces, so a large face has larger panels than a small face. However, it would be more accurate to have panels of the same size across all faces so we plan to implement this as a future refinement. In Dynamo we showed the sightlines coloured according to whether the sightline can see the rooftop addition (red – fail) or not (green – pass). Each viewpoint is shown as a sphere coloured according to their percentage score (green is 100%, red is 0%). In tight urban areas, many of the viewpoints can’t see the addition and are therefore green.
Refinery
By the start of the second day, we had a working prototype in Dynamo and set about implementing it in Refinery to generate a series of options. The parameters controlling the size and position of the rooftop volume were set as the inputs (Length, Width, Height, Rotation, XOffset and YOffset) and the Volume and Mean Score were set as the outputs. We chose the Optimize method which takes two, or more, competing variables as outputs and works to optimize the results for given population size over a number of generations. In the Hackathon we were restricted by time to experiment with low numbers for both but were still able to get useful results. One run is plotted below with Mean Score (X-Axis) compared to Volume (Y-Axis). It shows that there is a strong inverse correlation between the two output variables as you would expect: as the volume of the addition gets larger, it becomes more visible from the street.


The Height and Volume are strongly correlated which is also to be expected. A closer examination of the pairwise correlations between the variables reveals some obvious results: the dimensions of the cuboid (Length, Width and Height) are fairly strongly correlated with the Volume and negatively with the Mean Score. More subtle (and useful) are the offsets which indicate that the XOffset has little bearing on the Mean Score, but the YOffset is negatively correlated which means that moving the cuboid south produces better scores for this situation because that part of the roof is more hidden by an adjacent building. The YOffset range can then can be adjusted to focus on this area for further passes with Refinery.
To check that the Optimize method is working well for us we can compare against Refinery’s Randomize method, which randomizes the input variables to produce a specified number of results. The chart below shows the Optimize method results in red compared to the Randomize results in blue.

The majority of the Randomize results are less efficient, where the Volume achieved is less than could otherwise be achieved for the same Mean Score. For example, there are two results circled in black that achieve a Mean Score of 88% but one (right) has double the Volume. The smaller is prominently located on a visible corner and doesn’t make use of the more hidden part of the roof behind the taller adjacent building.

Results

Future Development
The Dynamo graphs and example files can be found on the Stealthy Roofscapes GitHub repository. The prototype developed at the Hackathon was necessarily rough around the edges and there are lots of refinements to be made to improve it as a tool. Contributions are most welcome!

Biographies

Bogdan Davydov
Bogdan is a BIM Specialist at 3D Repo focusing on the development of cloud-based software in the AEC Industry.
Wiktor Kidziak
Wiktor is an Architect at ARUP working in the Science and Industry Sector. Experienced in innovative computational methodologies, his focus is to deliver architectural and BIM solutions for complex multi-disciplinary engineering projects.
Thomas Corrie
Thomas is an Associate Director at Hopkins Architects in London where he leads the implementation of Building Information Modelling.